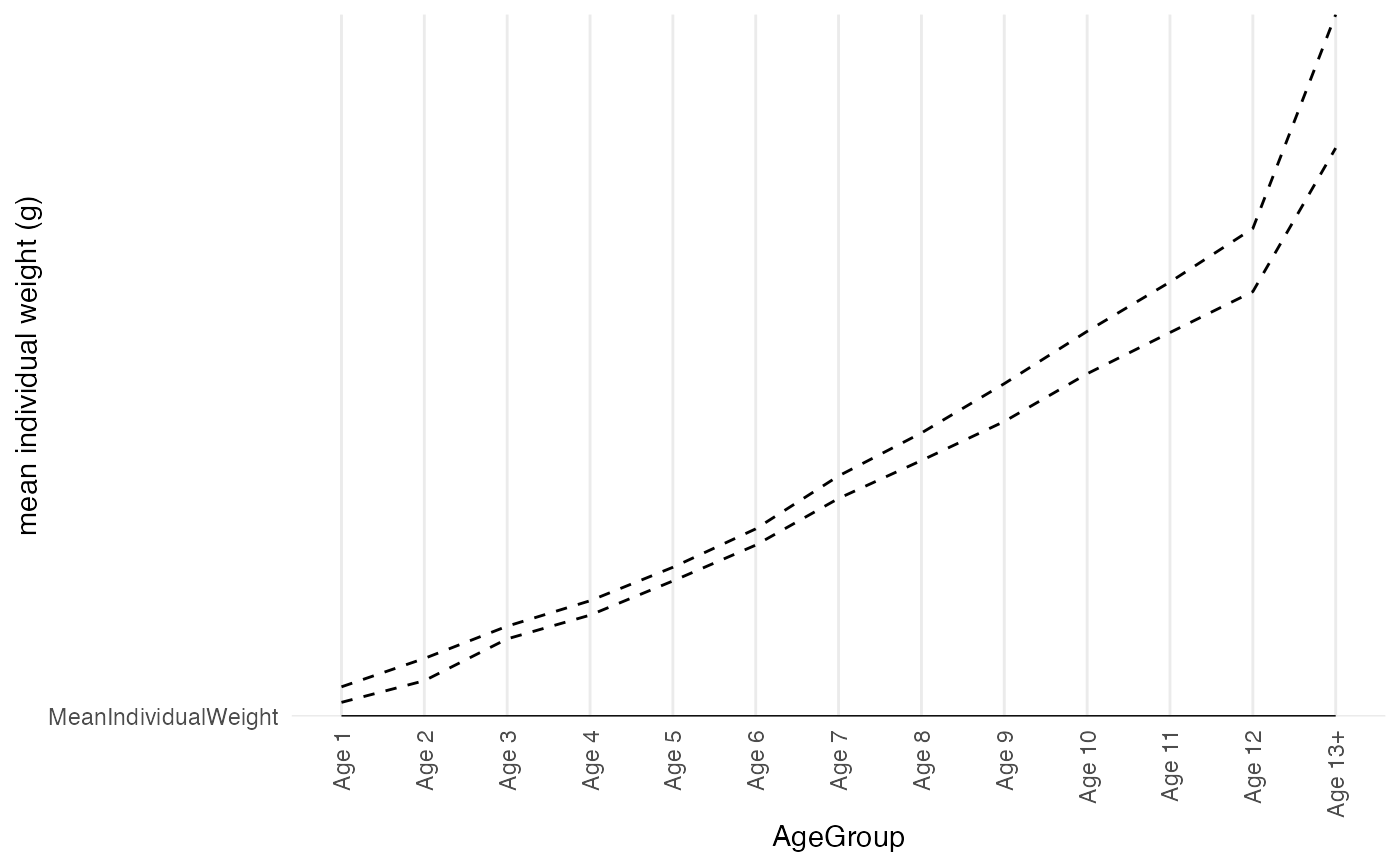
Plot mean individual weight for each age group, along with an interval representation for the error of the mean. The interval plotted is as configured in 'ReportFdaWeightAtAgeData' (the interval Low / High) and is represented by dashed lines.
The interval does not represent the range of length occurring in each age group, but the error of the estimate of mean weight
If any grouping variables are configured for argument 'ReportFdaWeightAtAgeData', groups will be plotted in different colors.
Arguments
- ReportFdaWeightAtAgeData
ReportFdaWeightAtAgeDatawith mean weight statistics from Reca simulations
See also
Provide data for this plot with e.g. ReportRecaWeightAtAge
Examples
 weightAtAge <- RstoxFDA::ReportRecaWeightAtAge(RstoxFDA::RecaCatchAtAgeExample,
        PlusGroup = 13)
 RstoxFDA::PlotMeanWeightAtAge(weightAtAge)
