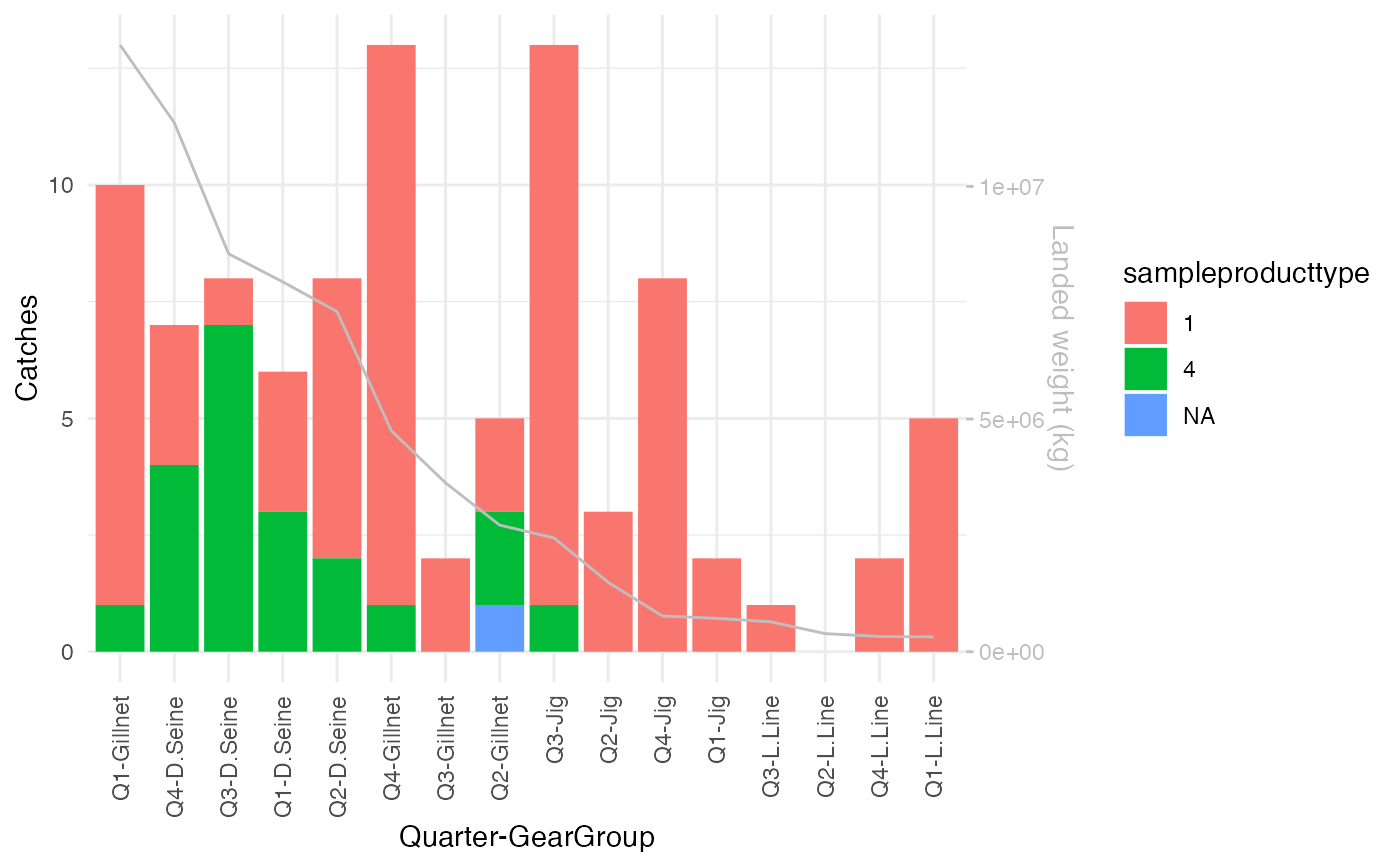
Plots a barplot for a sample quantity, illustrating the number of samples that has the sample variables in 'ReportFdaSamplingData'. If the fishery is partitioned by grouping variables a stacked barplot is produced. Total landings may be plotted on a secondary axis.
Usage
PlotSamplingVariables(
  ReportFdaSamplingData,
  Quantity = c("Catches", "Vessels", "WeightMeasurements", "LengthMeasurements",
    "AgeReadings", "WeightOfSampledCatches"),
  Landings = FALSE
)
Arguments
- ReportFdaSamplingData
ReportFdaSamplingDatawith sampling report to plot- Quantity
the sample quantity to plot for each sampling variable: "Catches", "Vessels", "WeightMeasurements", "LengthMeasurements", "AgeReadings", or "WeightOfSampledCatches"
- Landings
if TRUE total landings in each part of the fishery ('GroupingVariables' in ReportFdaSamplingData) is plotted on a secondary axis.
See also
Provide data for this plot with ReportFdaSampling
Examples
 #Plot to inspect how many samples (catches) where taken for each producttype
 samplingReport <- RstoxFDA::ReportFdaSampling(RstoxFDA::StoxBioticDataExample,
           RstoxFDA::StoxLandingDataExample,
           GroupingVariables = c("Quarter", "GearGroup"), SamplingVariables=c("sampleproducttype"))
 PlotSamplingVariables(samplingReport, Quantity = "Catches", Landings = TRUE)
