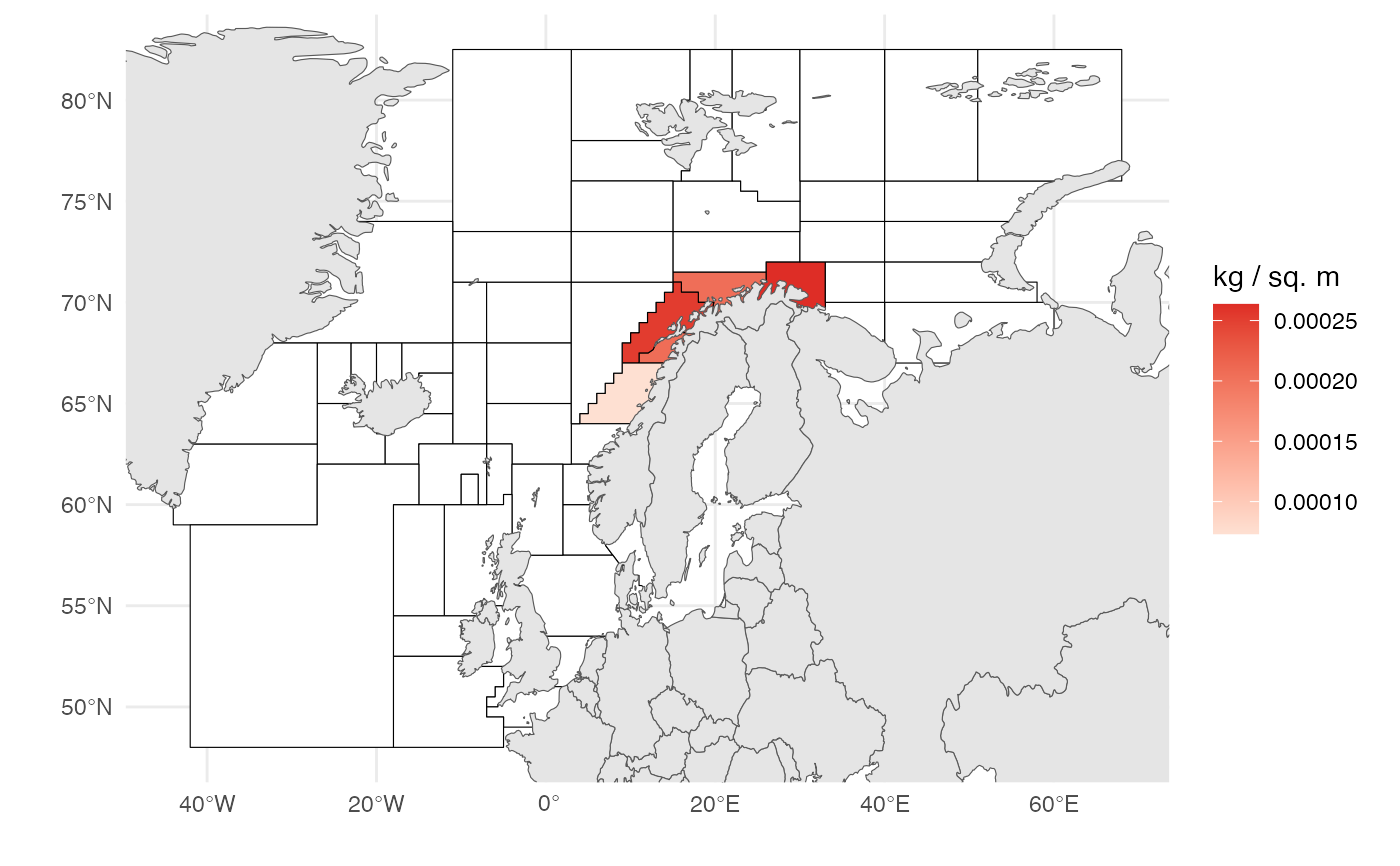
Plots catch density of landings on polygons.
Arguments
Details
'ReportFdaLandingData' must be configured with only one grouping variable, which must match the area names in StratumPolygon$StratumName
See also
Provide data for this plot with ReportFdaLandings
Examples
 landingsReport <- RstoxFDA::ReportFdaLandings(
       RstoxFDA::StoxLandingDataExample, c("Area")
       )
 RstoxFDA::PlotFisheriesOverviewSpatial(landingsReport, RstoxFDA::mainareaFdir2018)