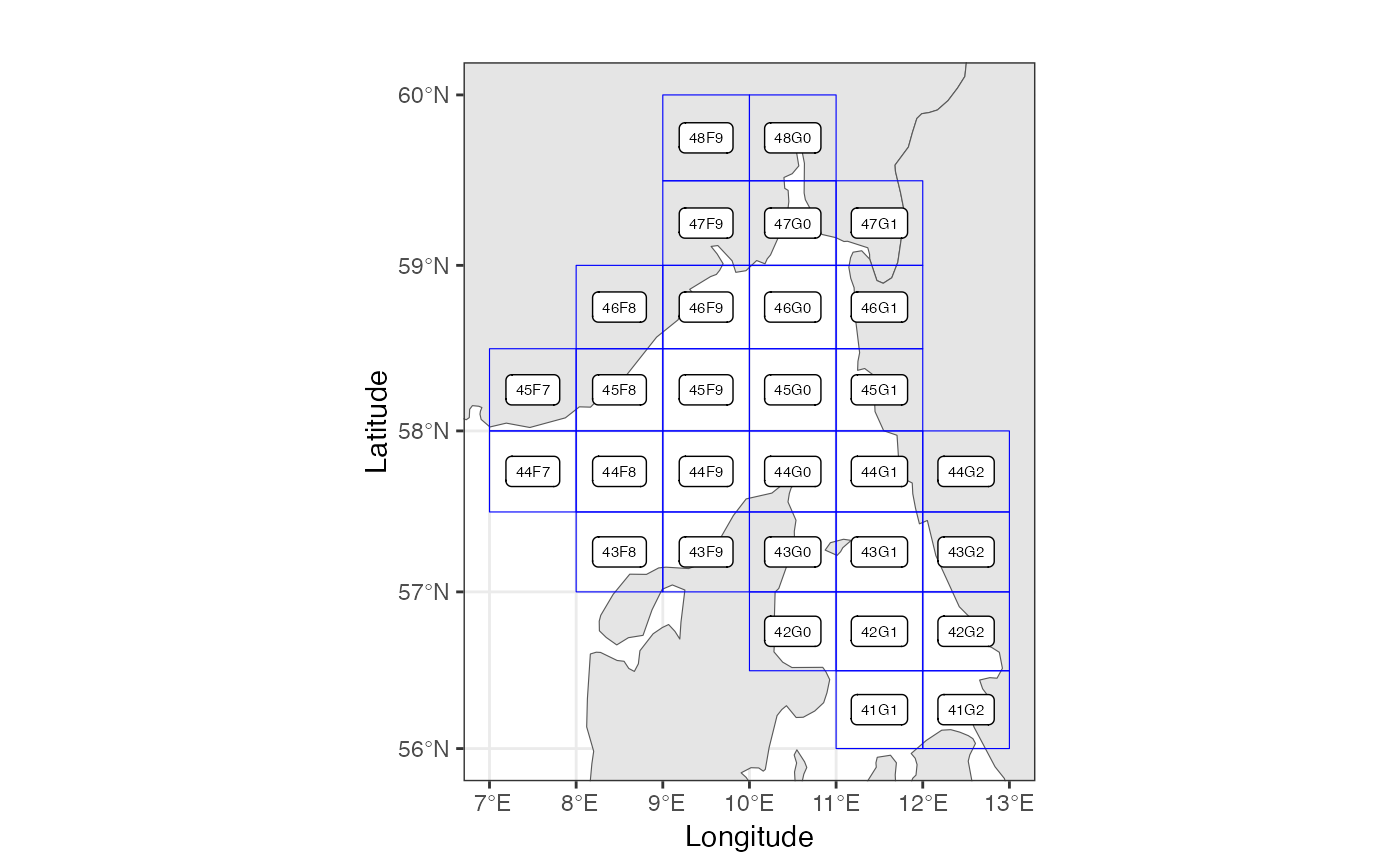
Definitions for ICES rectangles. ICES rectangles are defined by grids made up from integer longitudes, integer latitudes, and a bisection between each pair of latitudes. They derive their name from being rectangular in mercator projection.
Usage
data(ICESrectangles)Format
sf with area names identified in the column 'StratumName'. See StratumPolygon (v.2).
Details
The data contains the following columns with rows for each rectangle:
- ICESNAME
name of the rectangle in standard ICES notation
- SOUTH
southern border of rectangle (latitude)
- WEST
western border of rectangle (longitude)
- NORTH
northern border of rectangle (latitdue)
- EAST
eastern border of rectangle (longitude)
- Area_Full
Code for full ICES area, including the FAO area code (27).
- Area_27
Code for full ICES area, excluding the FAO area code (27).
The data also contains columns for the individul components of the full ICES area code: <Major_FA>.<SubArea>.<Division>.<SubDivision>.<Unit>
Polygons are derived from shapefiles provided by ICES web-portals.
Polygons are defined in WGS84 coordinates (unprojected).
Examples
 # plot statistical rectangles in 27.3.a
 rect27.3.a <- RstoxFDA::ICESrectangles[
    RstoxFDA::ICESrectangles$SubArea==3 &
    RstoxFDA::ICESrectangles$Division=="a",]

 RstoxFDA::plotArea(areaDef = rect27.3.a)
